Oscilloscopes
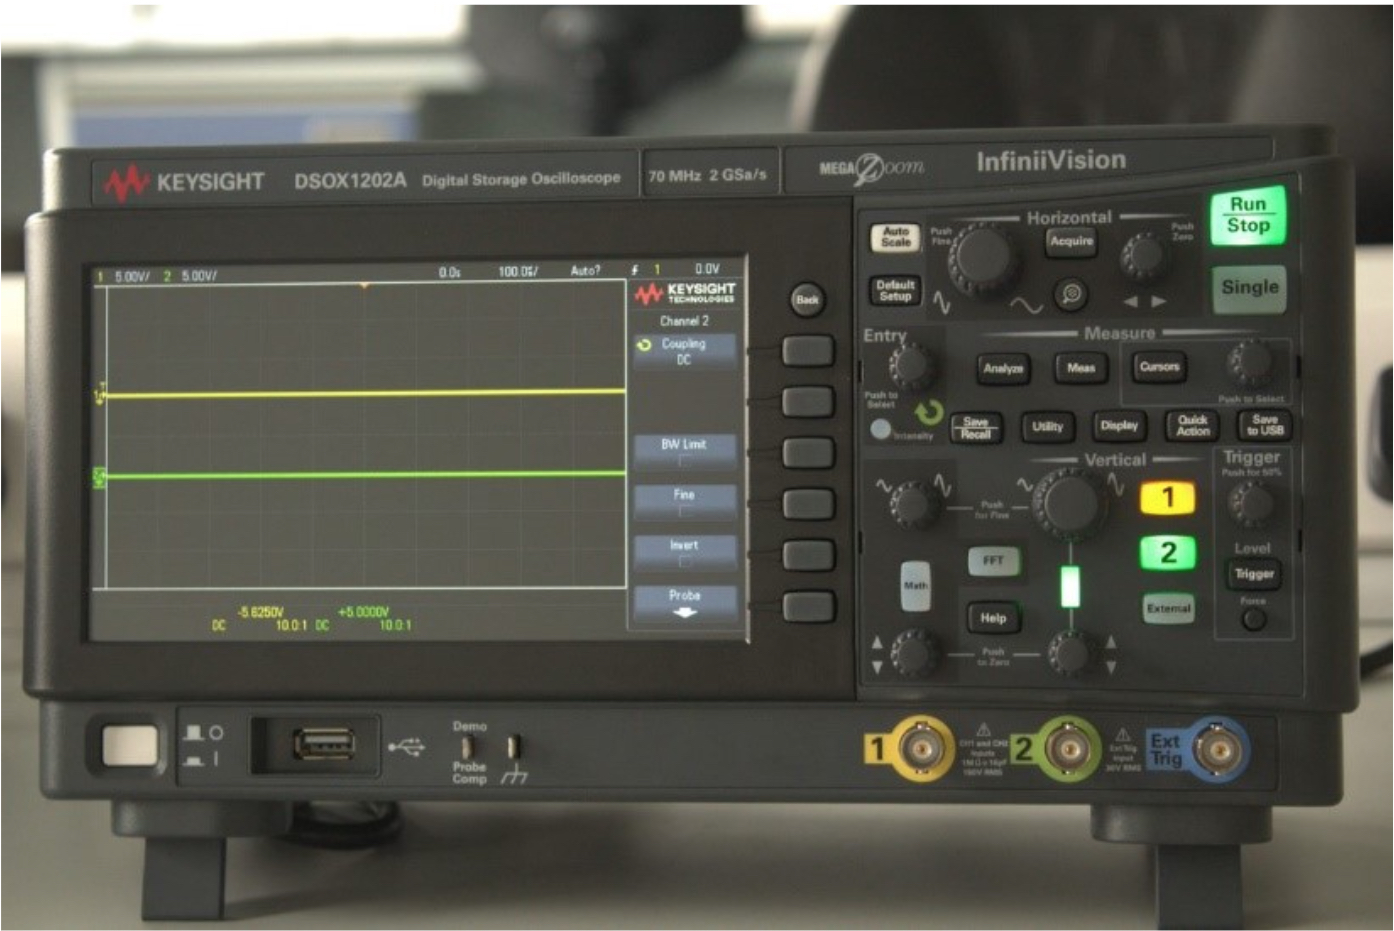
Oscilloscopes display a two-dimensional representation of one or more potential differences, normally of voltage on the y-axis against time on the x-axis. The plot is drawn on the screen by a point that responds to a time-varying voltage by moving in the vertical direction while scanning repeatedly from left to right, making the oscilloscope useful for displaying periodic signals. The resulting pattern is referred to as a "trace" or "waveform".
A quick guide to get you started!
When using an oscilloscope, we can plot one sinusoidal signal along the x-axis against another sinusoidal signal along the y-axis.

Despite the initially menacing look of oscilloscopes their basic operation requires little more than an understanding of the simple transformations of graphs: translations, scalings and reflections. The Oscilloscope Guide describes how to use the oscilloscopes that you’ll see in our undergraduate laboratories. In fact, most oscilloscopes you will come across have the same controls and only differ in appearance
Links
|
Oscilloscope Guide
Lissajous Figures
BNC-Banana Adapter
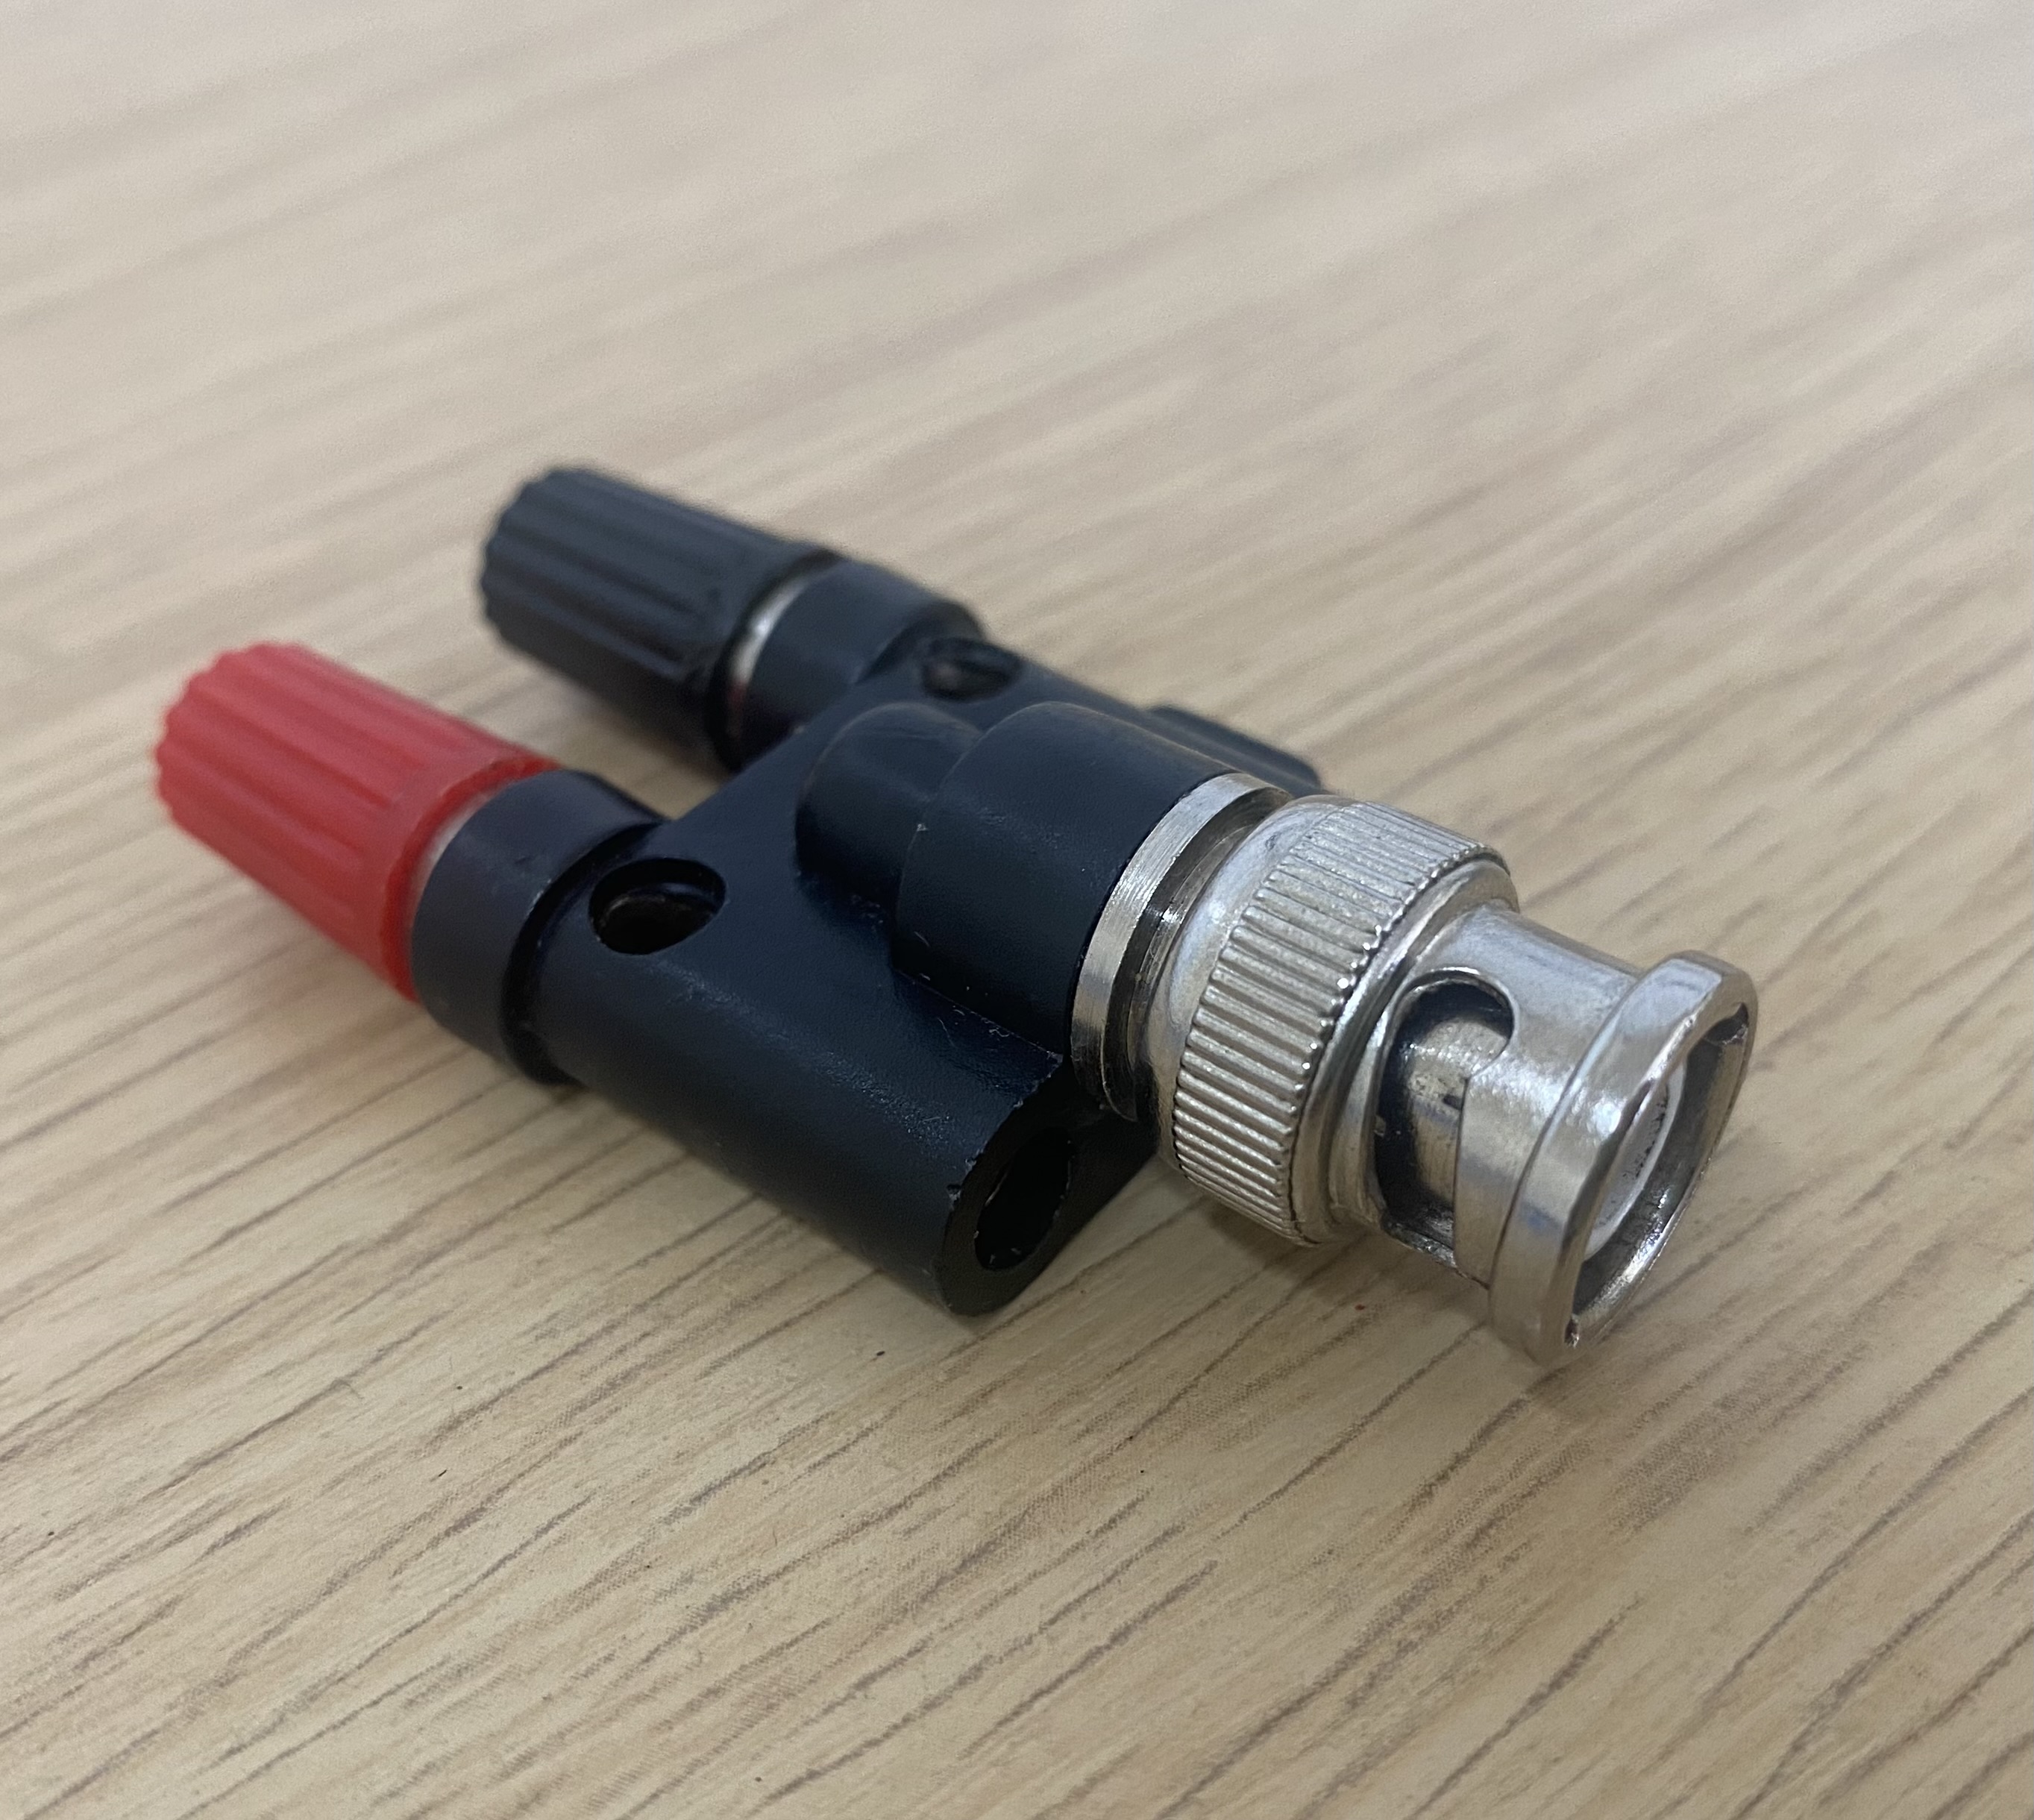
BNC-Banana adapters allow you to connect the banana cables that you normally use in the labs to the BNC jack of an oscilloscope. BNC jacks both take in an input signal and produce an output signal. If you inspect the BNC end of an adapter (bottom end in the picture) you will see that it consists of an inner and an outer connector. At the other end are female sockets for both a live (input) and a neutral (output) banana cable.
If you unscrew the black and red caps on the adapter, you can also grip ordinary wires.
The BNC connector was designed to minimize signal reflection in radio frequency circuits and is widely used to terminate coaxial cables


Fig. 1: BNC to (female) banana adapter.
Other Resources
Although these links are good, they all describe oscilloscopes that are slightly different from those used in the labs.


/prod01/prodbucket01/media/durham-university/departments-/physics/teaching-labs/VT2A9034-1998X733.jpeg)
/prod01/prodbucket01/media/durham-university/departments-/physics/labs/Osc1.jpg)
/prod01/prodbucket01/media/durham-university/departments-/physics/labs/circuits2_1.jpg)